Golang之profiler和trace工具
Golang 之profiler和trace工具
在生成环境中使用Golang需要很多优化,才能满足性能需求,通常优化点在于CPU占用。Golang提供了丰富的工具,包括内置的profiler和trace工具,来帮助我们完成任务。
一、 Profiler
Golang自带了profiler工具,即为C++中的gperftools包。而且提供api和http两种接口。实际项目中http接口更为方便,下面以http接口为例说明:
- 在golang程序中,开启profiler接口123456func main() {go func() {log.Println(http.ListenAndServe(":5567", nil))}()//other program code}
嵌入以上代码,即可在编译生成的二进制程序中打开profiler的http接口。
- 可以通过浏览器查看profiler数据
http://127.0.0.1:5567/debug/pprof/

- 同时也可以通过命令行来查看cpu占用
go tool pprof http://127.0.0.1:5567/debug/pprof/profile
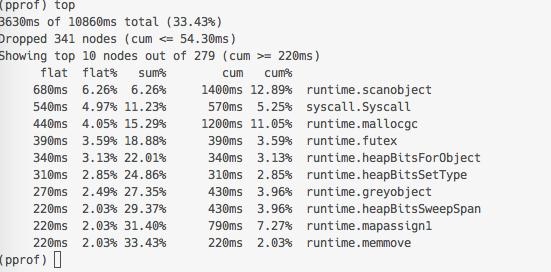
命令行还可以图形化显示cpu占用拓扑图。鉴于开发机没有安装X环境,暂不详述
通过找出cpu占用top10的函数,来不断优化性能。
二、FlameGraph
uber开源了一个工具,可以十分方便地查询profiler数据生成火焰图,如此优化性能更为直观。
首先需要安装工具:
go get github.com/uber/go-torch
go get github.com/tools/godep
godep restore
git clone https://github.com/brendangregg/FlameGraph.git
上述操作需要设置正确的PATH来执行godep,go-torch,flamegraph.pl
执行:
go-torch –time=15 –file “torch.svg” –url http://127.0.0.1:5567
上述命令会收集
http://127.0.0.1:5567/debug/pprof/profile 的数据,并调用flamegraph绘制torch.svg火焰图。
如下: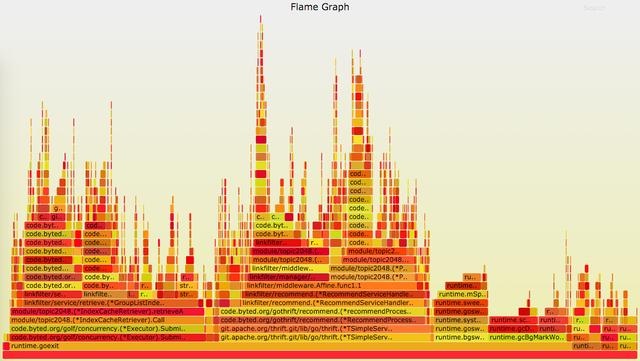
三、Trace
首先需要收集二进制的trace数据。
curl 127.0.0.1:5567/debug/pprof/trace?seconds=10 trace.data
上述命令收集10秒的trace保存在本地的trace.data文件中,该文件是二进制的。其次需要将二进制的trace数据转换为json格式。执行
go tool trace -http=’:8888’ golang_server trace.data
其中golang_server是127.0.0.1:5567对应的二进制golang程序,trace.data是上述抓取的二进制数据。新开终端,执行
curl 127.0.0.1:8888/jsontrace trace.json
将前一步的trace.data转换层trace.json格式。
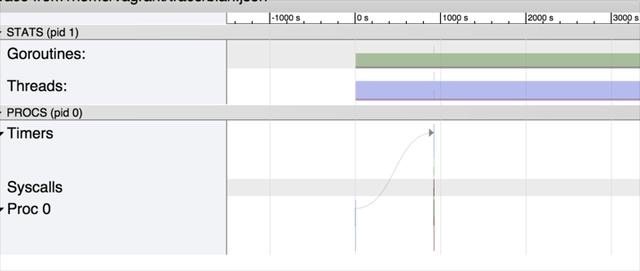
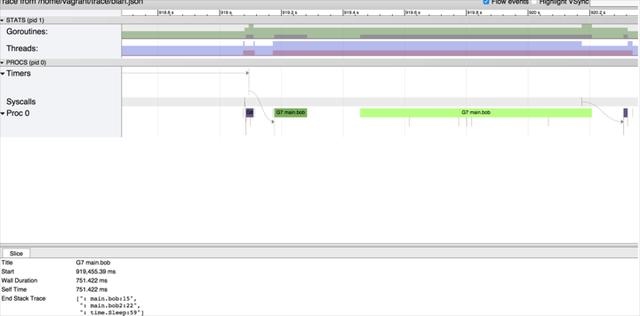
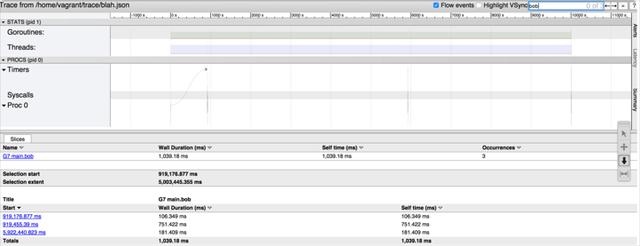
- 再次将trace.json转换为html格式。
到https://github.com/catapult-project/catapult/tree/master/tracing下载trace-viewer工具,执行
./trace2html ~/trace/trace.json
生成trace.html文件,使用浏览器打开,如下。